Signal-to-Noise Ratio in Absorption Imaging

Requires a Wolfram Notebook System
Interact on desktop, mobile and cloud with the free Wolfram Player or other Wolfram Language products.
This Demonstration analyzes the signal-to-noise ratio (SNR) for a typical absorption image in a cold-atom experiment.
Contributed by: Zhichao Guo (August 2022)
Open content licensed under CC BY-NC-SA
Snapshots


Details
Three components of an absorption image are denoted by:
 , the input light distribution on the atom,
 , the output light (after absorption),
 , the background.
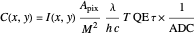
The formula for calculating the optical density (OD) is
 ,
,
where
 ,
,
 is the intensity distribution of light on the atom,
 is the pixel size of the camera,
 is the real pixel size including the magnification of the image system,
 is the wavelength of the probe light,
 is the transmission rate of the image system,
 is the camera quantum efficiency,
 is the analog-to-digital conversion efficiency of the camera,
 is the exposure time.
The noise can be written as

Then, the SNR is
 .
.
References
[1] G. Reinaudi, T. Lahaye, Z. Wang and D. Guéry-Odelin, "Strong Saturation Absorption Imaging of Dense Clouds of Ultracold Atoms," Optics Letters, 32(21), 2007 pp. 3143–3145. doi:10.1364/ol.32.003143.
[2] Thorlabs. "Camera Noise and Temperature Tutorial." (Apr 16, 2021) www.thorlabs.com/newgrouppage9.cfm?objectgroup_id=10773.
Permanent Citation
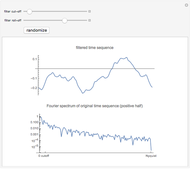 Filtering a White-Noise Sequence
David von Seggern Noise Temperature of a Radar System
Marshall Bradley Random Matrix Theory and Gaussian Noise Thresholding
Jessica Alfonsi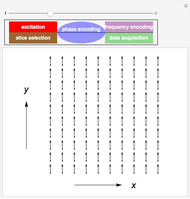 Magnetic Resonance Imaging (MRI)
Yuncong Ma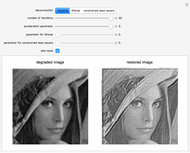 Image Restoration for Degraded Images
Siva Perla Single Signals in Nuclear Magnetic Resonance
Chengchen Guo and Jeffery L. Yarger Multiple Signals in Nuclear Magnetic Resonance
Chengchen Guo and Jeffery L. Yarger Detecting a Signal with Background Noise
Nick Arango Signal Detection Theory
Garrett Neske Tempered Fractionally Differenced White Noise
Ian McLeod, Mark Meerschaert and Farzad Sabzikar
